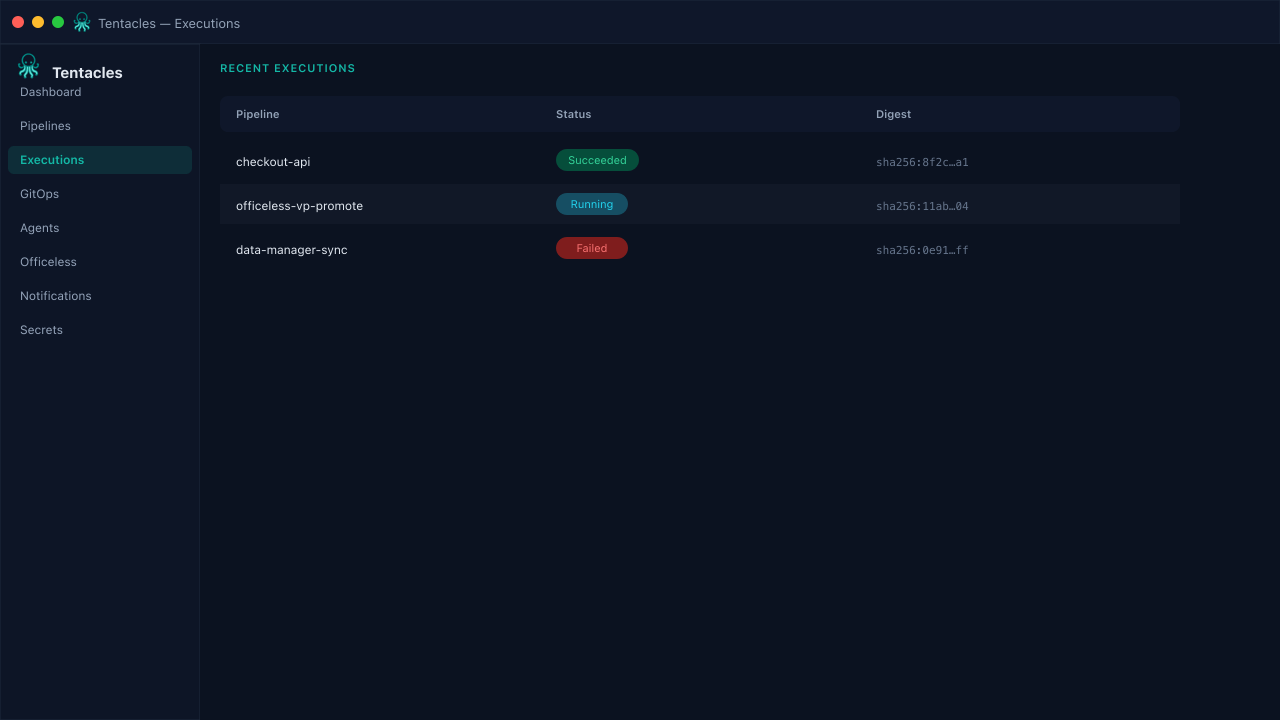
Live pipeline dashboard
See total pipelines, active runs, and success rate the moment you open Tentacles — no separate BI tool required.
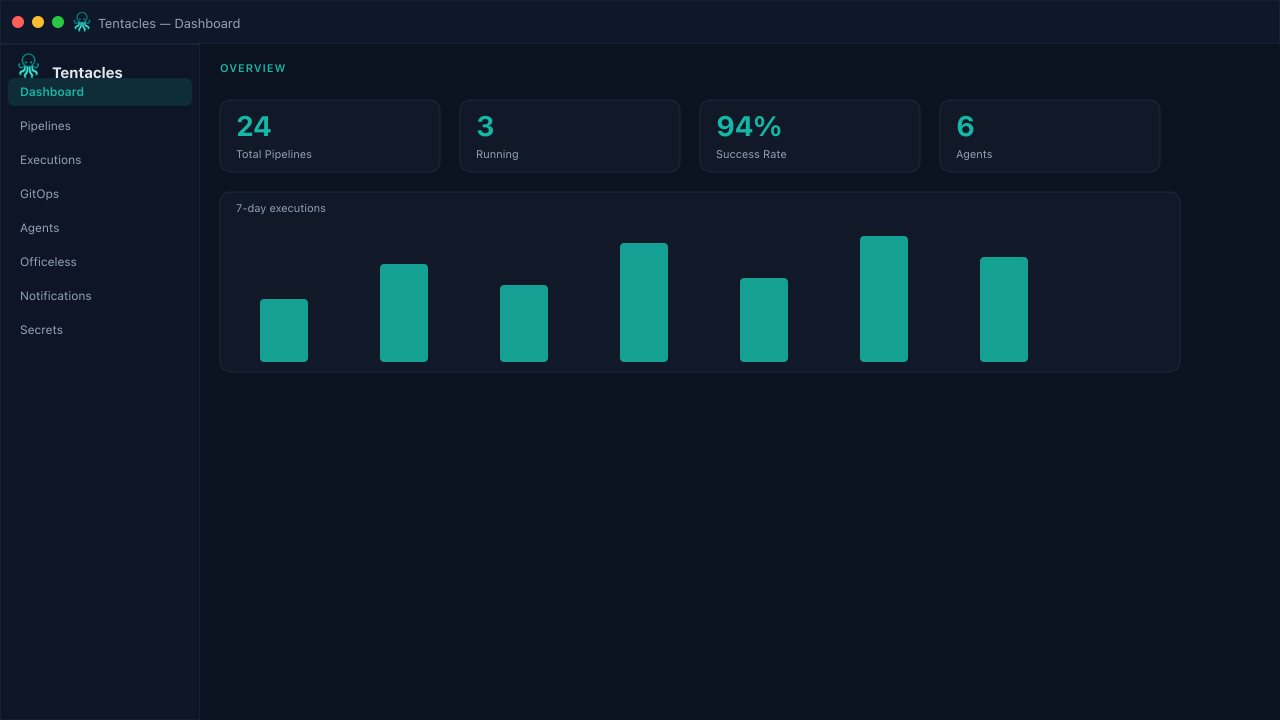
Illustrative preview of the live pipeline dashboard screen in Tentacles
Before you start
- At least one pipeline created
- An org account with dashboard access
Step by step
- 1
Open the Dashboard
Sign in and land on Dashboard — the default view after login. Metrics load from a single call to the control plane.
- 2
Read the top-line metrics
Total Pipelines, Running executions, Success Rate, and online Agents update from live execution data, not a cached snapshot.
- 3
Scan daily executions and recent runs
The 7-day bar chart splits success versus failure per day; Recent Executions links straight into a run's timeline for triage.
Tip: Click any row in Execution History to jump directly into that run's live log.